

Hey there! As a supplier of Magnetic Chemical Pumps, I often get asked about how to read the performance curve of these pumps. It might seem a bit daunting at first, but once you understand the basics, it's not that hard. In this blog, I'll break it down for you step by step.
What is a Performance Curve?
First things first, let's talk about what a performance curve is. A performance curve is basically a graph that shows how a pump behaves under different operating conditions. It gives you a visual representation of how the pump's flow rate, head (pressure), power consumption, and efficiency change as the conditions change.
Most performance curves have the flow rate on the x - axis (the horizontal line) and the head on the y - axis (the vertical line). There are also usually lines on the graph that show power consumption and efficiency at different points.
Reading the Flow Rate and Head
The flow rate is the amount of fluid that the pump can move in a given amount of time, usually measured in gallons per minute (GPM) or liters per minute (LPM). The head, on the other hand, is the pressure that the pump can generate to move the fluid. It's usually measured in feet (ft) or meters (m) of water.
Let's say you look at the performance curve of one of our Magnetic Chemical Pumps. You'll see that as the flow rate increases, the head decreases. This is because as you try to move more fluid, the pump has to work harder against the resistance in the system, and it can't generate as much pressure.

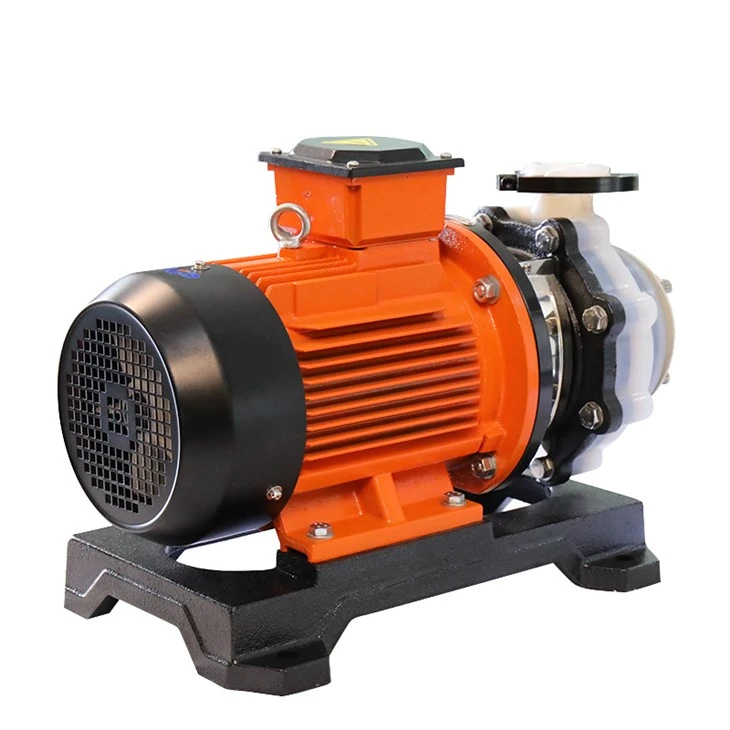
For example, if you have a Idle Acid and Alkali Resistant Self - Priming Pump, the performance curve will show you how much fluid it can move at different pressures. If you need to move a large amount of fluid, you'll have to accept a lower head. But if you need to generate a high pressure, the flow rate will be lower.
Understanding Power Consumption
Power consumption is another important factor to consider when reading the performance curve. The power consumption line on the graph shows how much electrical power the pump uses at different flow rates and heads.
As the flow rate and head increase, the power consumption also increases. This is because the pump has to work harder to move more fluid and generate more pressure. You want to find the sweet spot on the curve where the pump is operating efficiently and not using too much power.
For instance, our Acid and Alkali Resistant In - tank Vertical Pump has a specific power consumption pattern. By looking at the performance curve, you can determine the most energy - efficient operating point for your application. This can save you a lot of money on your electricity bills in the long run.
Efficiency Matters
Efficiency is a key metric when it comes to pumps. The efficiency line on the performance curve shows how effectively the pump converts electrical power into hydraulic power (the power to move the fluid).
The efficiency of a pump usually reaches its maximum at a certain flow rate and head. This is the point where the pump is operating most effectively. You want to try to operate your pump as close to this peak efficiency point as possible.
Take our Fluorine Plastic Centrifugal Pump(Direct Connection) for example. The performance curve will show you the peak efficiency point. If you operate the pump far from this point, it will be less efficient, and you'll end up wasting energy and money.
System Curve and Pump Curve Interaction
It's also important to understand the interaction between the pump curve and the system curve. The system curve represents the resistance in the piping system that the pump has to overcome. It shows how the head required to move the fluid through the system changes with the flow rate.
The point where the pump curve and the system curve intersect is the operating point of the pump. This is the flow rate and head at which the pump will actually operate in your system.
If the system curve changes (for example, if you add more piping or change the diameter of the pipes), the operating point of the pump will also change. You need to make sure that the pump can still operate efficiently at the new operating point.
Factors Affecting the Performance Curve
There are several factors that can affect the performance curve of a Magnetic Chemical Pump. One of the main factors is the viscosity of the fluid. If the fluid is more viscous (thicker), the pump will have to work harder to move it, and the performance curve will shift.
The temperature of the fluid can also have an impact. Higher temperatures can reduce the density of the fluid, which can affect the pump's performance.
The speed of the pump is another important factor. Most pumps are designed to operate at a specific speed. If you change the speed of the pump, the performance curve will change as well.
Real - World Applications
Let's look at some real - world applications of reading the performance curve. Suppose you're working in a chemical plant, and you need to transfer a corrosive chemical from one tank to another. You'll need to select a pump that can handle the chemical and operate at the right flow rate and head.
By reading the performance curve of our Magnetic Chemical Pumps, you can determine which pump is the best fit for your application. You can also optimize the operation of the pump to ensure that it's running efficiently and effectively.
Conclusion
Reading the performance curve of a Magnetic Chemical Pump is an essential skill for anyone who uses or selects these pumps. It allows you to understand how the pump will perform under different conditions, choose the right pump for your application, and operate the pump efficiently.
If you're in the market for a Magnetic Chemical Pump or have any questions about reading performance curves, don't hesitate to reach out. We're here to help you make the best decision for your needs. Whether you need a pump for a small - scale laboratory application or a large - scale industrial process, we've got you covered.
References
- Pump Handbook, by Igor Karassik et al.
- Chemical Engineering Fluid Mechanics, by Ron Darby.